Opportunities
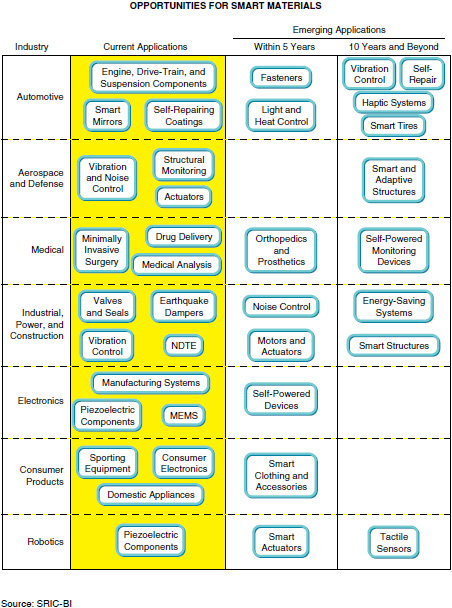
The section opens with this simple Timeline Chart to summarize the various application areas for the technology and to indicate how the technology will see development in its application in various industries in the next ten years. Further figures in the Opportunities section indicate a mixture of possible value chains and networks and industry structures and business models.
