2004–05 MacroMonitor Products and Services Analysis Volume Interim Report: Insurance
| Summary Table of Contents |
Download the summary and table of contents Download the complete interim report (clients only) |
Interim Report Summary: Insurance
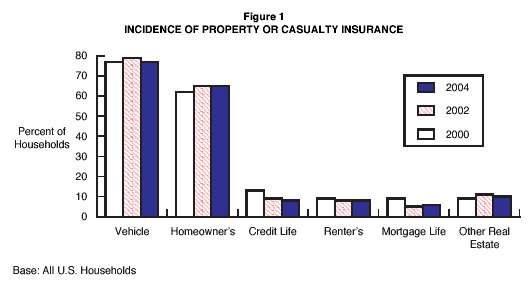
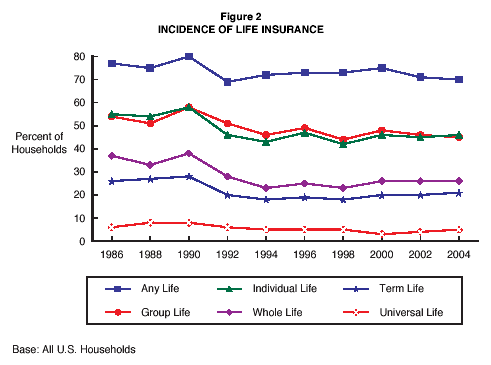
Although recent geopolitical and natural events highlight more than ever the importance of protection, insurance numbers generally remain stable with no appreciable signs of growth. Seven in ten U.S. households have some type of life insurance in 2004, with 45% having group life and the same proportion having individual coverage—incidences that have remained unchanged from two years ago. Similarly, property and casualty insurance data remain stable, with more than three-quarters of all U.S. households having vehicle insurance and 65% having homeowner's insurance in 2004.
The MacroMonitor data on health insurance highlight the reality of the increasing unavailability of health-care benefits for many U.S. households. Slightly more than 86 million households have some type of health insurance, accounting for 71% of total households and reflecting a decline of 15% from just two years ago. The retired household population experienced the most severe drop: The proportion of Younger Retirees with health or health-related insurance fell by 30%, from 83% in 2002 to 58% in 2004—most likely a result of cutbacks on retiree health benefits provided by many corporations.
Other key findings from the 2004–05 MacroMonitor insurance data include the following:
- Property and casualty insurance. Although the number of households with property and casualty insurance has been creeping up (from 104 million households in 2000 to about 109 million households in 2004), the level of market penetration for various types of property protection has remained relatively stable in the past three survey waves.
- More than three-quarters (77%) of U.S. households have vehicle insurance, and 65% have homeowner's insurance. Just one in ten have other real estate insurance, and a smaller proportion have renter's, credit, or mortgage insurance.
- Increasing home values and mounting claims have led to rising insurance premiums. The annual premium for homeowner's, renter's, and other real estate insurance increased from $460 in 2000 to $600 in 2004: up by 30%. The median annual premium for vehicle insurance among all vehicle owners rose by 16% to $1,100 in 2004, from $948 in 2000.
 |
- Life insurance. Incidences for group life and all types of individual life insurance in 2004 remain well below 1990 levels. Group life coverage has dropped to 45% of total U.S. households, and individual life is down to 46% of U.S. households, from a high of 58% each in 1990.
- Affordability continues to be the main stumbling block to having life insurance coverage. In 2004, roughly half of those households that do not have some form of life insurance indicated that they cannot afford it. No insurance provided at work is increasingly a factor for noncoverage: In 2004, 17% of households without life insurance indicated that they don't have it for this reason, versus 13% in 2000.
- Among households with individual life insurance, the majority (57% in 2004) have a whole life policy. Fewer than half have a term policy (47%), and only about one in ten own a universal, variable, or interest-sensitive insurance policy.
- Most households purchase their individual life insurance policy from an insurance agent, although incidence has been declining with time: 58% in 2004, compared to 65% in 2000 (and 67% in 1998). An increasing percentage of households purchase their policy directly from an insurance company (15% versus 12% four years ago).
- The median total annual premium paid for individual life insurance has not changed significantly, hovering about $500 in the past four years ($504 in 2004). The median total annual premium paid for universal ($882) in 2004 is more than double that paid for term ($425) or whole ($400).
 |
- Health insurance. U.S. households fortunate enough to have health insurance face rising premiums and bigger deductibles. Since 2000, the median annual premium for health and health-related insurance increased by 70%, to $1,700 in 2004.
- Six in ten households have group health or health-related insurance; just 19% have individual coverage. These 2004 data represent an 18% drop in incidence for group coverage and a 34% drop in incidence for individual from two years previously.
- The contrast in incidences of health and health-related insurance between the most affluent and the least affluent households is staggering: By Socioeconomic Level, nine in ten High households are covered, compared to just three in ten Low households. Moreover, incidence of coverage for High households remained relatively stable in the past two years; that for Low households dropped by half, from 64% in 2002.
- Fewer households now have health-related insurance. The incidence for dental insurance is 44% in 2004, about the same proportion (45%) as in 1998. Eye-care insurance dropped to 28% in 2004 from 45% in 2002, long-term care fell to 12% from 15% in both 2002 and 2000, and supplemental—first measured in 2002 at 23% incidence—is down to just 10% in 2004.
- Disability insurance. Roughly one in five U.S. households have disability insurance: 16% have group disability; only 3% have individual coverage. Among households with disability insurance, almost seven in ten pay an annual premium for their coverage. The median premium is $200 for 2004, up from $168 in 2000.
- Travel and accident insurance. The incidence of U.S. households carrying travel and accident insurance has not changed significantly in the past six years (6% in 2004). The median premium of $85 in 2004 is lower than it was two years previously ($120).
- Professional and regular liability insurance. The number and incidence of households with professional and regular liability insurance continue to remain stable: Roughly 14 million or 12% of households have this type of insurance. The premium for this product, however, increased sharply, going from a median annual amount of $300 in 2000 and 2002 to $500 in 2004.
- Accidental death and dismemberment insurance. About one in five households carry this type of insurance in 2004, the incidence remaining relatively stable in the past four years. The median annual premium for this type of insurance in 2004 is $119, roughly the same as in 2002 and 2000.
<< See other Interim Reports
Interim Report Table of Contents
| Insurance | ||||
| Summary | 1 | |||
| Property and Casualty Insurance | 5 | |||
| Vehicle Insurance | 7 | |||
| Homeowner's, Renter's, and Other Real Estate Insurance | 12 | |||
| Mortgage Insurance | 19 | |||
| Credit Insurance | 22 | |||
| Life Insurance | 25 | |||
| Group Life Insurance | 31 | |||
| Individual Life Insurance | 37 | |||
| Term Life Insurance | 45 | |||
| Whole (Straight) Life Insurance | 50 | |||
| Universal, Variable, or Interest-Sensitive Life Insurance | 56 | |||
| Policy Loans | 60 | |||
| Health or Health-Related Insurance (Excluding Disability) | 63 | |||
| Health Insurance | 73 | |||
| Health-Related Insurance (Excluding Disability) | 80 | |||
| Disability Insurance | 84 | |||
| Other Insurance | 90 | |||
| Travel and Accident Insurance | 90 | |||
| Professional and Regular Liability Insurance | 93 | |||
| Accidental Death and Dismemberment Insurance | 99 | |||
<< See other Interim Reports