MacroMonitor Market Trends August 2010
MacroMonitor Market Trends is a newsletter from the Consumer Financial Decisions group that highlights topical news and trends of interest to you and your colleagues. If you would like more information about the items in the newsletter or would like to discuss other ways that we can assist you in your research and marketing efforts, please contact us.
In this issue:
What If the Wealthy Stop Spending?
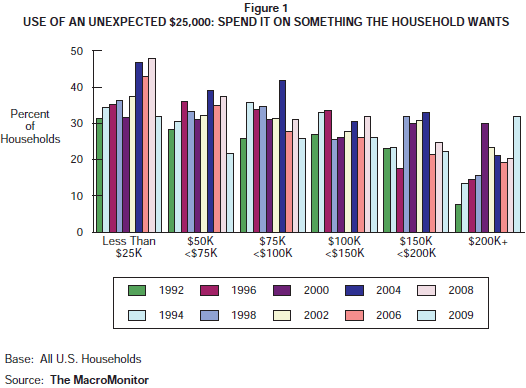
Recently, a New York Times article made the point that the 2009 recovery was primarily due to affluent households' overcoming the uncertainty that others felt and coming back to spending. However, in 2010, the recovery has lost momentum, and some people believe that that loss is because the wealthy have slowed down their spending. The top 5% of consumers account for a disproportionately large amount of consumer spending, especially for nonessentials—sometimes as much as a third of all outlays. The MacroMonitor trend of households that would spend a $25,000 windfall on something the household wants provides supporting evidence that the wealthy were key to supporting the recovery.

The trend by annual household income indicates a pattern for households making less than $100,000: Spending went up throughout the 1990s. This same pattern is evident for households with $200,000 or more in income. However, once we cross Y2K, the spending pattern becomes more erratic: Households with less than $75,000 in annual income become more likely to say that they would spend this windfall, and households with $150,000 or more say that they are less likely to do so. The pattern for households between $75,000 and $150,000 tends to jump up and down.
What is particularly interesting and revealing is what happens between 2008 and 2009. When the same households that we interviewed in the spring and summer of 2008—before the fall—answered the same $25,000 windfall question in February 2009, fewer households from every income range said that they would spend it (significant for households with incomes of less than $75,000). The exception was households making $200,000 or more. Significantly more of these households say that they would spend this windfall than said so when they were interviewed a year before.
Having higher incomes and being willing to spend them right at the bottom of the market decline may be the height of contrarian behavior. However, since the market nadir, many signs—continued unemployment, lower consumer confidence, increased market volatility—have indicated that the economy is not roaring back to full health. If, as the New York Times article suggests, the wealthy have pulled back their spending, then unless other segments begin to spend more (and few have the resources to do so), this recovery may be on hold. When the 2010–11 MacroMonitor data become available this fall, we will have critical additional evidence about the state of spending among the wealthy, the mass affluent, and the mass markets.
Don't Worry, Be Happy
This article is the first in a series featuring CFD's new Leverage Points analysis. We base Leverage Points on groups of attitudes in the MacroMonitor data that form cohesive themes. For this first article, we chose from the 27 Leverage Points one that has a large number of defining attitudes and both "agree" and "disagree" components: Satisfied and Confident. The attitudes that inform this Leverage Point are:
- Agreement with:
- I am currently in a position to meet my long-term financial goals.
- I am confident that my retirement savings and investments are sufficiently diversified.
- I am satisfied with my household's current financial situation.
- I am confident that my savings are sufficient to tide me over in case of illness or disability.
- I am confident that my savings and investments are sufficiently diversified.
- My investments are so good that I don't need any new life insurance.
- Disagreement with:
- I'm afraid my household is not saving enough for its future needs.
- I am worried that I will not be able to get a loan when I need one.
- I don't have as much life insurance protection as I should.
In addition to the direct measures that give this Leverage Point its name, several other elements—such as sufficient savings to handle emergencies, comfort with diversification of investments, and knowing that credit is readily available if necessary—correlate with being Satisfied and Confident. It is interesting that having sufficient life insurance (or not needing any) is a characteristic that the households that score high on this Leverage Point all share.
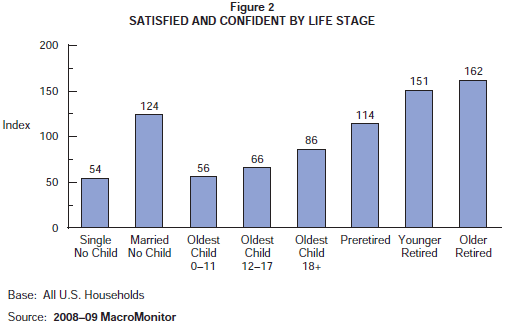
Figure 2 shows how households in our Life Stage segments index for inclusion in the top quartile of scores for the Satisfied and Confident Leverage Point. An index of 121 or more is above average, an index of 80 or less is below average, and an index from 81 to 120 is an average incidence of inclusion in the top quartile of scores. First, we segment households by Life Stage on the basis of the age of the oldest dependent child—regardless of age or retirement status of the primary head. Next, we identify households that are retired and split them into Younger-Retired and Older-Retired segments on the basis of the age of the primary head of household—the cut is at age 70. We separate households with no kids and not retired on the basis of whether the primary head of household is younger than 45 years of age or 45+. Households in the 45-and-older group are Preretired. We classify households younger than age 45 on the basis of marital status: Single No Child or Married No Child.

When analyzing Figure 2, we look for segments that are not average—ones that either over- or underindex—because they are significantly more or less likely (statistically) to demonstrate the characteristic we call "Satisfied and Confident." When we compare a segment that overindexes with one that underindexes, we know that members of the groups are likely to be very far apart on this characteristic. The case is so for the Single No Child (index = 54) and the Married No Child (index = 125) Life Stage segments. Without further investigation, we can't be sure whether the increased chance for financial bliss is due just to having a committed relationship or whether two incomes is the key. We can be very confident, however, that we cannot speak to all child-free households with the same voice when trying to move them on an issue or purchase decision where the Satisfied and Confident dimension is important (see the July 2010 newsletter article "The Dynamic Challenge of Serving Child-Free Households").
Not surprisingly, the chart also suggests that the Life Stages with younger children place the greatest strain on households' financial comfort. Time, however, tends to be kind to many households, providing the opportunity to improve financial circumstances or, perhaps, just grow comfortable with life as it turned out. These data tell that those of us who actually make it to retirement have a better-than-average chance of finding financial contentment. So don't worry, be happy, and find a way to save along the way.
CFD Hosts Harnessing the Power of Leverage Points in the New Normal Mini-Presentation
To meet the new challenges that the financial-services industry faces, the Consumer Financial Decisions team has used the MacroMonitor's extensive battery of financial attitudes to develop 27 Leverage Points to provide competitive and consumer insights. On 27 July 2010, CFD hosted the third in a series of half-hour mini-presentations—Harnessing the Power of Leverage Points in the New Normal—that described how organizations can use Leverage Points to position themselves more effectively and create more compelling selling propositions for their products and services. Leverage Points can be useful to describe consumer segments—not define them—and can be a very useful way to understand better how consumer segments differ so that organizations can leverage those differences to market their products and services. Specifically, Leverage Points can be useful to:
- Evaluate the effectiveness of your current segmentation(s)
- Build richer, more insightful segments
- Develop strategies for the New Normal.
Because attitudes tend to shift before actual behaviors do, gaining a better understanding of consumers' psyches now is more important than ever as we enter this New Normal. To learn more how your organization can benefit from Leverage Points, email us at to obtain a copy of our mini-presentation.