MacroMonitor Market Trends August 2009
MacroMonitor Market Trends highlights topical news and trends of interest to you and your colleagues. If you would like more information about the items in the newsletter or would like to discuss other ways that we can assist you in your research and marketing efforts, please contact us.
In this issue:
Managing Mistrust in Financial Professionals
The recent market downturn has created immense challenges for many, if not most, U.S. households. The downturn eroded household savings and investments between September 2008 and February 2009 to the tune of $40,000 per household, on average, according to data from the 2008–09 MacroMonitor Recontact Study. For many households, the challenges are the same as they were a year ago: Planning for retirement, paying for children's education, buying a home, creating income in retirement, understanding taxes, and managing debt—but now these challenges are magnified. The questions remain whether households that are working with a financial professional will continue to do so, and if so, whether the type of financial professional will change. Will do-it-yourself households continue to stay on their own or will they turn to a financial professional for help in light of their heightened challenges? And if they do turn to financial professionals, which one will they choose and why?
The 2008–09 MacroMonitor Recontact survey reveals that of households with $100,000 or more in investable assets, roughly half use a financial professional and half do not. Those households that do not use a financial advisor are less likely to have suffered a financial loss between September 2008 and February 2009: Some 97% of households that use a financial advisor reported a loss to their savings and investments, in comparison with 78% of those that do not use a financial advisor. However, one should measure the real evidence of financial performance over long investing horizons, not in a short-term snapshot. According to evidence that a recent MacroMonitor Marketing Report, The Financial Advisor Advantage, highlights, households that use an advisor tend to do significantly better financially over time than do their do-it-yourself counterparts.
The question is, How will consumers value the relationship with their financial advisor moving forward? Even if the data point to an objective benefit over time of households' using a financial advisor, many consumers are likely taking a hard look at their household's financial strategy and the relationships they have with financial professionals. To win customers and maintain existing relationships, advisors must be ready to help consumers with the immense challenges that they face. The current environment creates a lot of uncertainty, and a financial professional who has holistic understanding of the economy and is in touch with the diversity of household needs will be in much greater demand.
Introducing CFD's Attitudinal Themes
During these uncertain economic times, understanding consumers' attitudes and perceptions about their finances, the economy, financial institutions and professionals, investing, risk, advice, life insurance, and health care are more important than ever. Using the 123 individual attitude items in the 2008–09 MacroMonitor, the CFD team has developed 27 unique attitudinal themes that enable us to delve deeper into the mind-set of the financial consumer than ever before. By analyzing populations on the basis of themes, rather than individual attitudinal variables, we can attain more holistic insights into and gain understanding of how consumers' financial attitudes relate to each other. Moreover, throughout the three decades of tracking consumers' financial attitudes and behaviors, MacroMonitor data have shown that changes in households' attitudes tend to precede changes in their actual behavior. Thus, understanding the underlying themes in financial consumers' psychology and how they change over time is key to recognizing not only issues of mass concern among consumers as a whole, but potential behavioral shifts among an institution's customers.
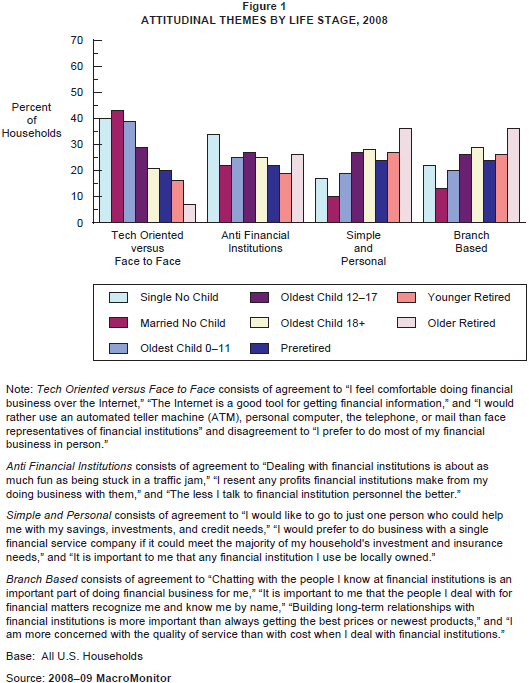
The attitudinal themes cover the entire spectrum of financial needs and can be segmented by virtually any population. Figure 1 uses CFD's Life Stage segments' attitudes toward how they manage their finances and transact to highlight not only the vibrancy of these themes, but the insight that they can provide. As Figure 1 portrays, a correlation exists between Life Stage and households' preferred level of contact with financial institutions. Households in the younger Life Stages are significantly more likely to be anti financial institutions and to prefer to use self-service technologies such as ATMs, computers, or telephones rather than face institution personnel. In direct contrast, the older Life Stage segments tend to desire simple and personal relationships with their local financial branch. This correlation leads us to ask: As households move through the Life Stages, do they become increasingly interested in personal, face-to-face contact with institutions or are we facing a major shift in how consumers interact with financial institutions? Using trended MacroMonitor data in conjunction with the attitudinal themes, the CFD team can help you find answers to important questions like these. For more information about how we created these themes or how your institution can best use them to understand your customers and prospects better, contact us.

Household Debt Creating Challenges for Business Owners
Surviving the current economic downturn can be challenging for even the most innovative and resilient households. Results from the 2008–09 MacroMonitor Recontact Study imply that business-owning households may rank among the most challenged. The study shows that business-owning households and non-business-owning households are equally likely to have suffered a loss to household saving and investments during the period between September 2008 and February 2009. And of those households suffering a financial loss, the magnitude of the loss between business-owning and non-business-owning households is very similar: 32% and 31%, respectively.
Stark differences exist, however, between some of the business-owning and non-business-owning households' attitudes about their household's financial situation. According to MacroMonitor Recontact data, business-owning households are significantly less likely than non-business-owning households to be satisfied with their household's current financial situation: Only 53% are satisfied, in comparison with 60% of non-business-owning households. Business owners are also significantly more likely than nonbusiness owners to agree that following a budget is more trouble than it's worth. The pessimism about their current financial situation also projects to the future: Only 62% feel optimistic about the households' financial situation in the next 12 months, in comparison with 66% of non-business-owning households.
One attributing factor to business-owning households' pessimism is their level of household debt: Some 40% of business-owning households believe that their household has more debt than it should, in comparison with 36% of non-business-owning households. And 49% of business-owning households would use an unexpected $25,000 windfall to pay off household debts, in comparison with 44% of non-business-owning households.
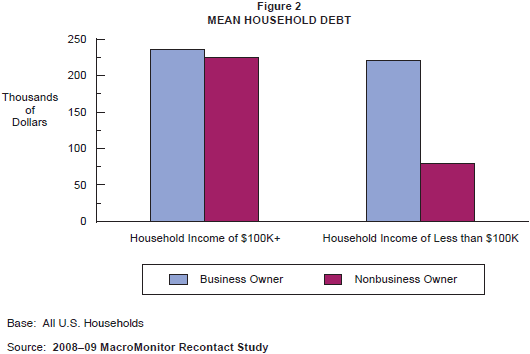
The real story behind the debt comes to life in a segmentation of the debt levels by household income. Business-owning households with an annual income more than $100,000 have a mean total debt of $197,247—comparable with the $206,798 in mean debt among nonbusiness owners with incomes of more than $100,000. However, business owners with household incomes of less than $100,000 have significantly more debt, on average, than have non-business-owning households with annual incomes of less than $100,000: $181,116, in comparison with $79,632. Financial institutions must be able to meet the credit demands of these households to help them grow their businesses and, likewise, provide the tools to small businesses to control debt levels that may be spiraling out of control.
