America's Affluent: Roadmap for the Twenty-First Century 2004–05 Affluent MacroMonitor Report
| Introduction Table of Contents |
Download the complete report (PDF) |
Introduction
This 2004 MacroMonitor Affluent analysis volume provides a unique perspective on the financials and demographics of the more than 23 million U.S. households that qualify as Affluent. Using trend information from the 1996–97, 2000–01, and 2004–05 MacroMonitor surveys, this report provides baseline information about the changes in demographic composition and the shift in financial activities for the Affluent market as a whole and for our proprietary Affluent segments as well. By providing key wealth indicators and demographic data, this report serves as a guide for financial marketers so that they can identify and serve the Affluent segments profitably. We analyze the segments' attitudes, behaviors, and institutional preferences for savings and investments separately.
The MacroMonitor's Affluent segmentation includes U.S. households with either a total annual income of at least $100,000 or total assets (excluding the primary residence) of $500,000 or more. To make our trend analysis more accurate and ensure that households with similar spending power are represented in each period, we adjusted for inflation all 1996 and 2000 dollar values in the database; thus, all dollar values in this report are in 2004 dollars. For example, all households in 1996 with at least $83,000 in income or $416,667 in total assets excluding the home are in the Total Affluent segment. For the 2000 data, the corresponding values are $90,090 and $454,545, respectively. Without indexing for inflation, the trend would significantly overstate the growth of the Total Affluent opportunity as a proportion of the overall household population (see the box below).
The comparative data below show how, without adjusting for inflation, one can significantly overstate the trend in the growth of the Total Affluent market. Using nominal (nonindexed) dollars to define affluence, a comparison of the Affluent market at different intervals shows a 47% increase in the number of Affluent households between 1996 and 2000 and a 35% increase between 2000 and 2004. The overall change in the eight-year period shows the Affluent market almost doubling from 11.5 million households in 1996 to 22.9 million in 2004. After adjustment for inflation of all 1996 and 2000 dollar values in the database, the Total Affluent household population still shows substantive increases but at much lower growth rates: 24% increase between 1996 and 2000 and 13% increase between 2000 and 2004—well above the rates of increase of the national household population (5% increase between 1996 and 2000 and the same percentage increase for 2000–04) but not as high as it would have been without indexing. 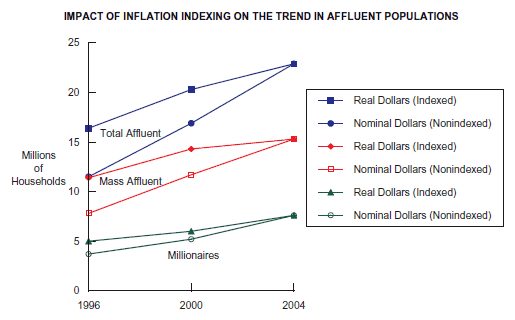
|
This report presents the demographic and financial profiles of the Total Affluent market on two levels: First, we draw a dividing line in the Total Affluent market between Millionaires (those Affluent households with a total net worth of $1 million or more) and the Mass Affluent (those households with a total net worth of less than $1 million). Second, we segment the Total Affluent market into six mutually exclusive groups on the basis of fundamental wealth attributes. For this segmentation, we first identified and pulled out the retired households (Wealthy Retired) and business owners (Entrepreneurs). Then we defined the remaining segments on the basis of the value of their primary home and their financial assets.
- Wealthy Retired—Affluent households in which the primary head either is retired or is age 65 years or older and works fewer than 20 hours per week.
- Entrepreneurs—Affluent households in which at least one household head's primary occupation is the ownership of or partnership in a business or professional practice.
- Balanced Builders—Affluent households with high levels of both real and financial assets. They have financial assets of $300,000 or more, and their home value is $200,000 or more.
- Focused Builders—Affluent households with high financial assets (equal to or greater than $300,000) and a home value of less than $200,000.
- Real Asset Builders—Affluent households with high real estate assets (a home value equal to or greater than $200,000) and financial assets of less than $300,000.
- Emerging Affluent—Affluent households with both a low level of financial assets (less than $300,000) and a low home value (less than $200,000).
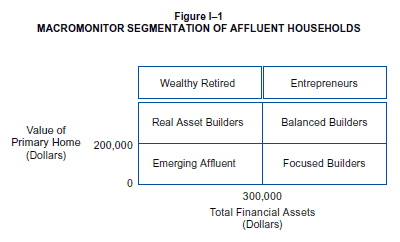 |
Table of Contents
| Introduction | 1 | |||
| Executive Summary | 4 | |||
| The Total Affluent Market | 8 | |||
| Mass Affluent and Millionaires | 20 | |||
| Mass Affluent | 21 | |||
| Millionaires | 32 | |||
| MacroMonitor Affluent Segments | 44 | |||
| Wealthy Retired | 45 | |||
| Entrepreneurs | 49 | |||
| Balanced Builders | 61 | |||
| Focused Builders | 72 | |||
| Real Asset Builders | 83 | |||
| Emerging Affluent | 94 | |||
| Appendixes | ||||
| A. MacroMonitor Survey Methodology | A-1 | |||
| B. Survey Weighting Procedures | B-1 | |||
| C. Affluent Segment Definitions | C-1 | |||
| D. Household Segment Definitions | D-1 | |||