Why-ology News: Trend Go beyond the what to the why of consumer behavior. April 2017
Water, Water Everywhere
Because of climate change, parts of the world suffer drought conditions. But in the beverage market, water everywhere is making big news. On 9 March 2017, the International Bottled Water Association and the Beverage Marketing Corporation (BMC) announced, "Americans are drinking more bottled water than any other packaged beverage—outselling carbonated soft drinks, by volume, for the first time in history." The bottled-water market is becoming more complex. Enhanced waters and flavored waters provide consumers with choices beyond "still" or "sparkling."
Both bottled-water sales and bottled-water consumption volume continue to increase. In 2016, bottled-water consumption grew to 12.8 billion gallons (an average of 39.3 gallons per year for every US consumer). Consumption translates to $16 billion at wholesale. At the same time, BMC statistics show average intake of carbonated soft drinks slipped to about 38.5 gallons.
In recognition of the shift in consumer tastes to more healthful beverage choices, cola kingpins (Coke and Pepsi) have included water in their product lineups for the past several years—Dasani for Coke and Aquafina for Pepsi. In fact, in September 2013, Coke, Pepsi, and Nestlé Waters teamed with first lady Michelle Obama to advocate drinking (bottled) water over sugary colas.

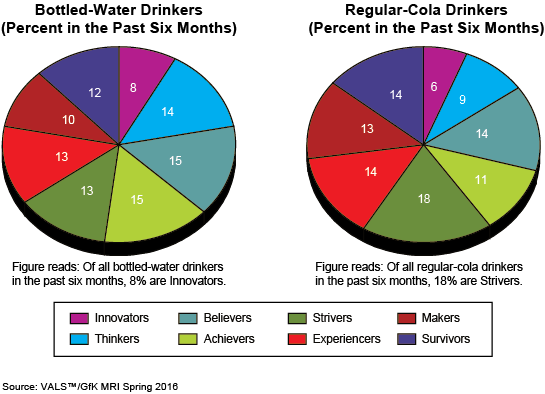
As of spring 2016, VALS™/GfK MRI data (the most recent data available) reported the gap between bottled-water and regular-cola drinking in the past six months was closing—44% of US adults drank bottled water, in comparison with 46% who drank regular cola. Some portion of all VALS groups drink both bottled water and regular cola. For marketing purposes, however, it's important to pay attention to the proportion of each group more likely than all US consumers to consume each type of beverage. For example, the pie charts show the distribution of the groups for each beverage type. Looking at the percent of each type drinking bottled water and drinking regular cola will inform your target-consumer selection process. Experiencers are the best target for bottled water; growth opportunity exists among Achievers and Innovators. Strivers and Makers are the best targets for regular cola drinks; growth opportunities are limited.
To learn more about how VALS can provide valuable insights for your business, contact us today.