MacroMonitor Market Trends Newsletter December 2019
If you are not a MacroMonitor sponsor but would like more information about this topic, please contact us.
The Middle
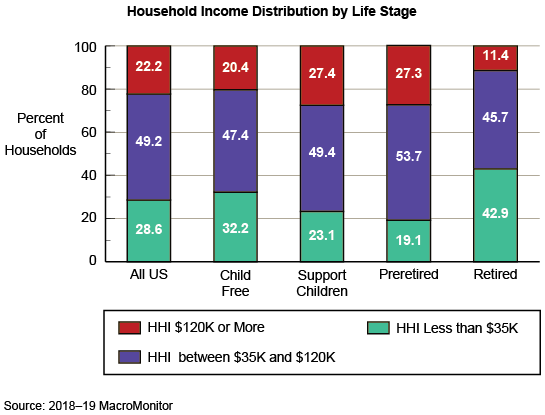
In the United States, income often defines middle-market households. The MacroMonitor reports that approximately one-half of all US households earn between $35,000 and slightly less than $120,000 per year. When prior wave data are adjusted for inflation, the proportion of households in the middle-income range has remained consistent for the past decade. In 2018, the middle-income group represents slightly more than 68.6 million households. Some 40 million households earn less than $35,000 per year; 31 million earn $120,000 or higher.
However, using household income alone to define a potential market is problematic: Looking at additional demographics can help size and profile subgroups within the middle. Doing so more accurately reveals the potential for financial products and services tailored to a household's specific needs.
To understand the middle market better and identify opportunities, one option is to define households on the basis of where the household is on its life path.

Investable assets, credit-card debt, face value of life insurance, primary financial goal, or other relevant differentiators can help. The MacroMonitor contains a complete selection of financial, channel, demographic, and attitudinal data to define and analyze any target of the middle market that your organization wishes to explore. For more information, please contact us.
Subscribers have access to this month's Segment Summary, Middle-Income Households, comparing financial behaviors, balance-sheet metrics, attitudes of households with and without children, and preretired and retired households. Upon request, subscribers may also receive the underlying set of data tables for this Segment Summary. For more information, contact CFD today.