MacroMonitor Market Trends October 2010
MacroMonitor Market Trends is a newsletter from Consumer Financial Decisions that highlights topical news and trends of interest to you and your colleagues. If you would like more information about the items in the newsletter or would like to discuss other ways that we can assist you in your research and marketing efforts, please contact us.
In this issue:
How Rich Are the Boomers?
Recently, a spate of articles have detailed the increasing concentration of wealth in the hands of the top 2% of households (by income) in the past two decades. At the same time, a generational transfer of wealth has occurred from the Greatest and Silent cohorts to the Boomers. Figure 1 shows how various cohorts' aggregate financial assets have grown (or shrunk) in the past two decades. These numbers are adjusted for inflation and include no tangible assets such as real estate, businesses, or collectibles or debt.
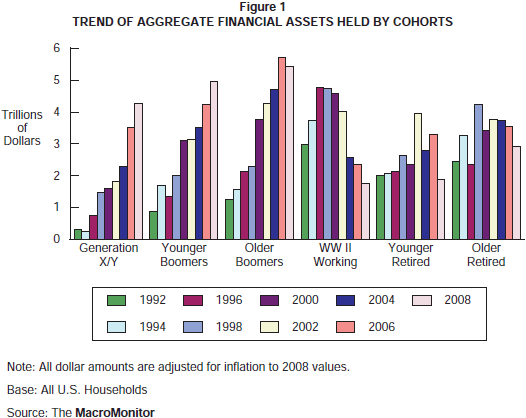
The pink bars show which cohorts have the majority of financial assets (as of 2008). It's no surprise that Boomers ($11 trillion) have almost double the amount held by the older ($6 trillion) and more than double the amount held by the younger ($4 trillion) cohorts. In fact, Boomers have more financial assets than have all other households combined. For the Boomers, the largest increase occurred between 1998 and 2000—a time when the aggregate financial assets of the retired cohorts actually decreased. The decrease in total financial assets among cohorts older than the Boomers started at about the same time, depending on whether they were working (1998) or recently retired (2002). These older cohorts are both decreasing in numbers (because of mortality) and using their financial assets for living expenses and other needs. Gen X/Y is growing in terms of the number of independent households and is on the growth tract of amassing savings.
Ignoring real estate and other tangible assets, the key to understanding the long-term impact of the recent recession does not reside in how much these financial-assets values have decreased—it would be easy to adjust these numbers on the basis of how different classes of assets have been affected or simply to wait for the 2010–11 MacroMonitor to release its next data set this fall. The key to assessing the real impact is in the degree to which recent events have affected the underlying attitude toward financial assets (including trust in the purveyors of such assets) as appropriate for the long term.
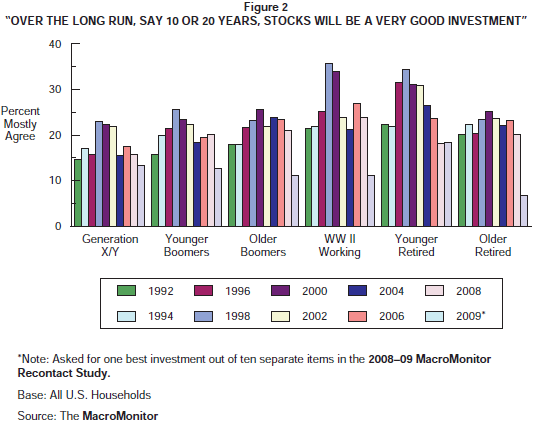
Figure 2 shows the proportion of households in each cohort that mostly agree with the statement "Over the long run, say 10 to 20 years, stocks will be a very good investment." The basic pattern is that throughout the 1990s, regardless of cohort, more people tended to agree strongly with this statement. But since 2000, the proportion agreeing with this statement has basically fallen through 2004 and then again from 2006 to 2008 (except for the Younger Boomers), frequently back to levels last evident in 1992. Although the question's wording in the 2008–09 MacroMonitor Recontact Study was different—respondents were asked "Thinking ahead 10 or 20 years, what do you think would be the best long-term investment for your household?"—the proportion picking stocks generally is even lower than the proportion who mostly agree that stocks would be a good long-term investment.
When we release the 2010–11 MacroMonitor data this fall, we will be looking very closely at this and scores of other questions—about product ownership, trust, goals, and financial needs and attitudes—to see how various cohorts have changed. Given the long-term trends, ample evidence suggests that the attitudinal shifts are rooted in a decade of experiences. Because of that fact and the remote prospects for a return to a vigorous, growing economy like we had during the 1990s, we expect that these attitudes will color cohorts' behaviors for at least the next several years and—in the case of the Younger Boomers, Gen X, and Gen Y—possibly for much longer. It will be the shifts in financial attitudes like these—more than the concentration of wealth in the hands of less than 2% of households—that will inform our insights about the direction of specific segments and support our advice and suggestions for sponsoring institutions' implementation decisions.
More Will Rely on Social Security
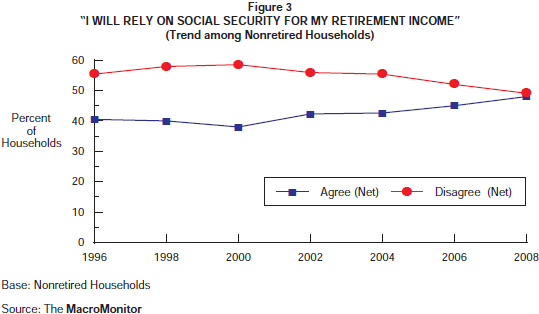
During the dot-com boom of the 1990s, fewer and fewer nonretirees indicated that they would rely on Social Security for their retirement income. However, throughout the 00s (say "uh-ohs"), the proportion of nonretired households that say they would rely on Social Security for their retirement income has increased to the point that in 2008, no statistical difference exists between those agreeing and those disagreeing.
As one would expect, the reliance on Social Security increases the closer the household is to retirement. A majority of households that expect to retire in less than the next ten years indicate that they will rely on Social Security for their retirement income.
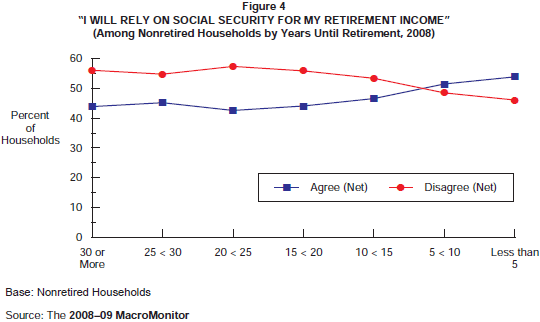
However, what is revealing is that during the past decade, an increasing proportion of households that are more than ten years from retirement say that they plan to rely on Social Security. Regardless of the frequent assertion that "Social Security will not be there for you," an increasing number of Younger Boomers and Gen Xers will rely on Social Security. It is possible that those households with a definite idea of when they will retire are more likely to consider Social Security as part of that retirement and that increasingly households are beginning to think that retirement is an unrealizable dream. Or it could be that diminished expectations of households' ability to save and invest on their own necessarily means that more will rely on Social Security as a safety net, as it was originally intended.
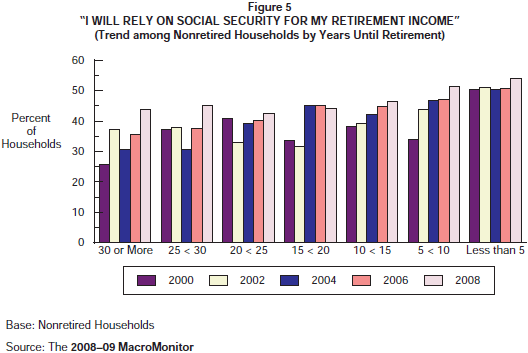
We have already experienced a "lost decade" in that the financial markets are all below where they were ten years ago. Many (if not most) homeowners also find themselves with significantly reduced equity in their real estate. An outlook for both the financial markets and real estate that suggests a very real possibility of another lost decade, in combination with increasing uncertainty for Social Security, means that these nonretired households—especially those that are within ten years of retirement—face some stark choices about their retirement security. And even for the rest of nonretired households, among those that are already planning to retire at a certain age, an increasing number consider Social Security to be part of that plan.
The New Data Are Almost Here
By the time you are reading this newsletter, the 2010–11 MacroMonitor data will be in the final stages of preparation for release. Given all the change and uncertainty surrounding consumers' financial needs—and given the importance for financial institutions to understand how those needs have changed and how better to meet them now—the information in this MacroMonitor may prove to be the most useful we have ever produced. To help you prepare for the data's release—and to help you prioritize the analysis you want to do first—the following is a short review of some of the new items that we have included and some of the old favorites that are particularly important in the current environment.
- Financial needs: Twenty-three specific financial-need areas (which can roll up into six "macro needs") are new. Consumers tell us how important each need is to them (Q.I-3) and how useful are the products and services they have to meet each need (Q.I-4). Households that say a need is important but that the products they have are not useful for that need are the key target to profile. Insights into the products and services to offer them can derive from a look at households that say the need is important and that their products are useful in meeting the need. Profiles of the gaps provide both product and marketing insights.
- Loss aversion: The paradigm has shifted from investment-performance-related trade-offs (risk/return) to a simple striving to avoid loss of principle. These new items enable sponsors to profile households on the basis of the strength of their loss aversion versus those that may be persuaded to take on some risk.
- Return expectations: Investors have consistently made decisions based on unrealistic expectations of their returns. Using these items, we may divide households into those that have a grounded expectation for their investment returns, those that have an exaggerated sense of entitlement, and those in between. Profiles of each will enable more directed marketing aligned with realistic expectations.
- Loss of wealth: Who has lost the most? Where have they lost it (real estate, securities, retirement accounts, businesses, and so on)? How have these losses affected their plans for retirement, relocation, philanthropy, asset reallocation, goal prioritization, future purchases? How has the loss of wealth affected households' other financial needs, including borrowing, saving, protecting their property and lives? Are households any more (or less) likely to use professional financial planners or advisors as a result?
- Deleveraging: How successful have (which) households been in lowering their indebtedness? Which areas have seen the most effect: cards, loans, mortgages? Where have the funds come from? What types of purposes are still inducing households to borrow? Which households are willing and able to borrow? What trade-offs are people willing to make to accelerate their deleveraging? Will households return to their profligate ways?
- Retirement expectations: Since 2001 when we first published our report on Redefining Retirement and the creation of the Revolving Retired, we have been waiting to see if the concept would gain traction. With the events of the past two years, we expect to learn if and how much the concept has been adopted by Boomers. The implications of this shift permeate nonretired households, because the entire concept of retirement will change. What should financial providers do to meet the needs of this new life stage?
- Home ownership: As the largest asset and debt on most households' balance sheets, the home (and the dream of obtaining one) has an outsize influence on their financial decisions. What are the ramifications of decreased equity in the home? How will households deal with the existing debt? How will new home formation be affected? What do households that are renting look like? How do financial providers integrate the desire to own a home with providing a package of financial products that meet current needs and build the potential for successful home ownership?
- Consolidation: Since 2000 households have stopped the trend of accumulating more financial products, services, and relationships. In fact, evidence indicates that the trend has reversed. Have the events of the past two years increased the speed of this consolidation? Who are the winners (and losers) of this new development? With the advent of complete convergence and product commoditization, financial providers will need to fine-tune their competitive strategy to focus on each segment of the market more holistically or compete to be the lowest-cost provider for one segment or one product.
- Disengagement: The cumulative experiences of the events of the past decade have educated consumers in the school of hard knocks, and they have grown skeptical, mistrustful, and unengaged. They yearn for an uncomplicated, simplified, and safe way to meet their financial needs, seeking less to be sophisticated consumers who gain an advantage over others, but striving more to ensure that they just don't mess up! Emulating the gestalt of this New Normal—in marketing, product design, employee training, customer service—is essential for financial providers' success.
The 2010–11 MacroMonitor data will provide insights into these and other pressing challenges.