MacroMonitor Market Trends May 2010
MacroMonitor Market Trends is a newsletter from the Consumer Financial Decisions group that highlights topical news and trends of interest to you and your colleagues. If you would like more information about the items in the newsletter or would like to discuss other ways that we can assist you in your research and marketing efforts, please contact us.
In this issue:
Underwater Homeowners Are Under the Gun
Housing markets are finally beginning to stabilize in many parts of the country after a multiyear decline that has left many households underwater—owing more on their home than it's worth. According to the Case-Shiller housing index, national median home prices have plummeted 29% since their peak in 2006. However, these data also indicate that recovery in many regions may be on the horizon, as the magnitude of the drops shrinks and as some markets post year-over-year gains. One of the key variables that have extended housing-price declines in the past few years is the rise in housing supply precipitated by homeowners' inability to pay their mortgages—a function of historically high unemployment rates. The supply of housing is also increased by people who strategically choose not to pay their mortgage because their home value has dropped to less than the mortgaged amount. The effect of these variables on the supply of housing will largely determine whether the stabilization of prices continues. It is important to look at those households that are the most likely to walk away—those that are currently underwater—to draw some inferences about the potential for strategic default. Table 1 presents a concise profile of these households from the 2008–09 MacroMonitor.
Table 1Underwater Homeowners' Profile |
||
|---|---|---|
| All U.S. Homeowners | Underwater Homeowners | |
Note: Bold indicates significant differences at the 95% confidence level. Source: 2008–09 MacroMonitor |
||
| Generation X/Y (born after 1962) (percent) | 33 | 53 |
| Median household income (dollars) | 60,000 | 60,600 |
| Median total financial assets (dollars) | 71,596 | 61,500 |
| Median total debt (dollars) | 75,200 | 331,050 |
| Obtained mortgage in 2005 or later (percent) | 37 | 41 |
| Have at least a four-year college degree (percent) | 35 | 39 |
| Even if I owe more on my house than it's worth, I will keep making my monthly mortgage loan payments (percent agree) | 79 | 88 |
Clearly, in some ways these households look like typical homeowners; in other ways they do not. Underwater homeowners are much younger than are homeowners overall but have similar incomes and similar educations; they typically have much smaller levels of net worth. Not surprisingly, underwater homeowners say that they are more likely to keep making mortgage payments even if they owe more on their home than it's worth (they wouldn't still be homeowners if the case weren't so!). Somewhat surprisingly, no significant difference exists between the two groups in whether they purchased the home in 2005 or later. It is important for lenders that they segment their portfolio of underwater mortgages to forecast defaults better and to understand how best to communicate with those households to avoid higher levels of mortgage delinquency.
Over Half of Households Pay a Professional to Do Their Taxes
Over half of all households (52%) pay a professional to prepare their tax returns. Nearly four in ten (39%) do their taxes by themselves, either with a computer program or without. Fewer than one in ten households have a friend or relative do their taxes for them. Now that the anxiety of submitting our returns is over—either for another year or until the extension period is up—it is interesting to see how few of us really do our taxes by ourselves without expert help (either electronic or personal).

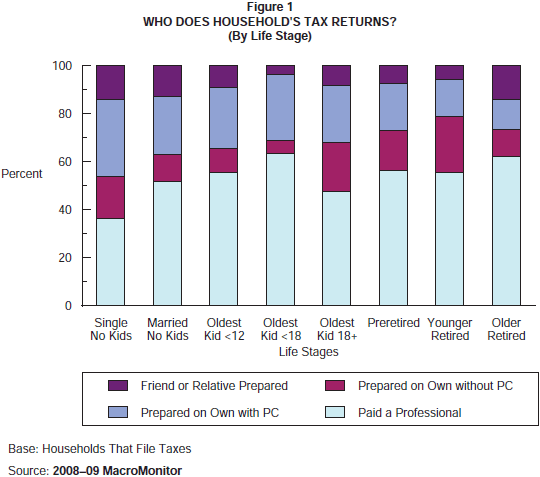
Interestingly, use of a professional to prepare one's taxes does not vary significantly among all households by age, income, education, marital status, or many other demographics. It does, however, correlate strongly with wealth, whether liquid, investable, financial, total assets, home equity, or net worth. Some correlation also appears with life stage, as Figure 1 suggests, specifically when teenagers are in the home and when the household is in the later stages of retirement.
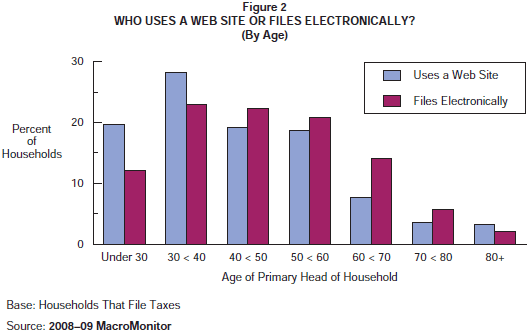
Doing one's taxes independently—either with a personal computer (PC) or without—is greatest among people just starting on their own and people with children older than 18 years (net of maroon and periwinkle bars in Figure 1). However, use of a PC to do one's taxes correlates closely with age: Most prevalent use is among younger households; use decreases as one moves through the life path. As Figure 2 shows, a similar pattern exists between people who file electronically and people who use a Web site to complete their tax returns. More households whose primary head is younger than age 40 have filed using a Web site; households whose head is 40 years old and older are more likely to file electronically.

Although it may be unrealistic to expect that the government will ever simplify taxes—the major Tax Reform Act of 1986 eliminated lots of tax shelters and deductions, but the resulting process is no less daunting—the increasing use of expertise, either electronic or organic, appears inevitable. Paying taxes is never pleasurable, but as recent experiences demonstrate, making it simpler would certainly go a long way to making it less painful.
Not Everyone Is in Dire Straits
Reading the news about the economy makes it not hard to start to feel like one is on a rollercoaster with all its ups and downs (and no idea of when the ride will end). Just as companies come out with record profits, a story breaks about increasing unemployment filings. The real estate market is at the heart of the troubles, but with declining values bottoming (one hopes), defaults mitigating, and builders increasing permit applications, it's hard to grasp the state of affairs, much less the direction. One often overlooked fact is that a sizable minority of homeowners actually owe nothing on their homes!

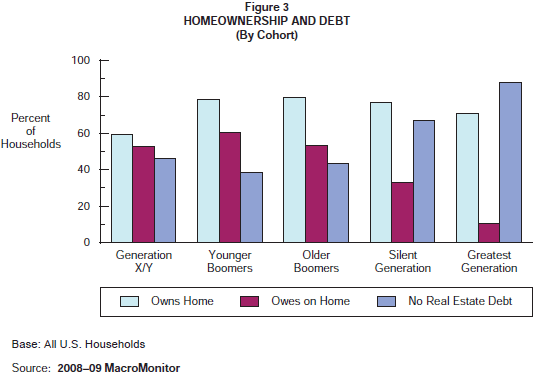
Even though the numbers in Figure 3 are from before the fall, one can safely assume that those homeowners who have no real estate debt (including on any secondary real estate) are in no danger of default. According to the 2008–09 MacroMonitor, about 40% of the Younger Boomer cohort—and even more of all other cohorts—have no real estate debt (periwinkle bars in Figure 3). For many younger households, part of the reason is that they are more likely to rent than own—fewer than 60% are homeowners. However, among all other cohorts for which homeownership is closer to 70% or 80%, the proportion owing any amount on their real estate starts at 60% and goes down to about 10% among the Greatest Generation. It may not make a great headline, but plenty of households are not in imminent danger of losing their homes. (And some of them have actually amassed considerable savings, but that topic is for another newsletter!)