MacroMonitor Market Trends February 2008
MacroMonitor Market Trends highlights topical news and trends of interest to you and your colleagues. If you would like more information about the items in the newsletter or would like to discuss other ways that we can assist you in your research and marketing efforts, please contact us.
In this issue:
Winners and Losers in the Real Estate Meltdown
The "ownership society" espoused by President Bush in 2002 appears to be slipping away as increasing numbers of homeowners lose their homes to foreclosure. In addition, falling real estate prices have placed more households in the position of owing more on their mortgage than their house is worth.
But despite the daily grim news about the implosion of the subprime-mortgage market, two significant portions of households remain largely unaffected by this crisis and perhaps could even benefit from it. The MacroMonitor estimates that nearly 37 million households—or three in ten U.S. households—are renters in 2006. No time is better than right now for these renters to become first-time homeowners—if, of course, they have enough income and sufficiently low levels of debt to meet the new tightened lending standards. Renters have no burden of owning an existing house that they would have to sell first before they could bid in the market. In addition, some 27 million households, representing one-third of all homeowners, own their homes free and clear with absolutely no mortgage debt. The fallout in housing prices could eventually mean lower real estate taxes for these homeowners.
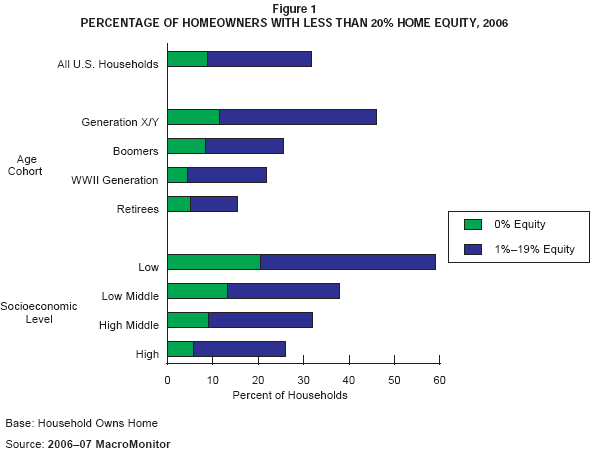
The average U.S. household may have enough cushion to withstand the drop in real estate prices. MacroMonitor data show that the average percent of the primary home's value that is available as equity in 2006 is 60%. However, this average masks the more troubling fact: Nearly one-third of all U.S. homeowners (32%) have less than 20% equity in 2006. And almost one in ten (8.8%) have no equity at all. Among homeowners in the Low Socioeconomic Level (a MacroMonitor parameter based on income and number of household members), the numbers are even more staggering: Six in ten homeowners (59%) have less than 20% equity in their homes; one in five (21%) have no equity. By Age Cohort, GenX/Y households are the most vulnerable: 46% have less than 20% equity, and 11% have zero equity. Home equity may have already evaporated for many of these homeowners given that the MacroMonitor data in Figure 1 reflect home prices at their 2006 peak.
Even with the Fed's recent cutback in interest rates and the government's proposed stimulus package, the situation for many homeowners could become worse before it becomes better. And for both well-positioned homeowners and renters on the one hand and vulnerable equity-challenged homeowners on the other, the financial and psychological impacts of the current real estate crisis will undoubtedly influence consumption, saving, and investing behaviors in the coming years. We expect the next MacroMonitor survey, with fielding due to begin in April 2008, to capture these initial changes to the consumer pocketbook and psyche. The 2008–09 MacroMonitor data should help financial institutions reposition their marketing strategies and product offerings effectively to meet the needs of U.S. households in the post-mortgage-crisis era.

Boomers: Ready to Retire?
In 2008, the first members of the Baby Boom generation are turning 62 and thus are eligible to begin collecting Social Security benefits. Financial researchers and marketers are all wondering how much time will pass before many of these households begin drawing down assets and live a life sans career. Currently, Boomers older than age 55 and not yet retired represent 15 million households. The 2006–07 MacroMonitor data show that of these 15 million households, a whopping 24% say that they plan to retire at the age of 62! The big question is: Can they really afford to retire? Receiving reduced Social Security benefits as a result of electing early retirement, coupled with having amassed inadequate financial assets and facing an increased life expectancy, would leave most early-retiring Boomers struggling to meet their current standard of living in their remaining years. Below is a profile of households in which the primary head is between 55 and 62 years old. The profile shows their level of assets in 2006 by percentile.
Table 1Asset Levels of Older Boomer Households by Percentile, 2006 (Dollars) |
|||
|---|---|---|---|
| Percentile | Total Assets | Total Financial Assets | Total Net Worth |
| Base: Households with a Primary Head 55 to 62 Years Old Source: 2006–07 MacroMonitor |
|||
| 10 | 46,300 | 3,000 | 12,966 |
| 20 | 120,520 | 12,256 | 78,400 |
| 30 | 186,000 | 31,000 | 129,080 |
| 40 | 277,786 | 69,400 | 199,868 |
| 50 | 380,500 | 108,443 | 271,081 |
| 60 | 474,729 | 161,000 | 375,785 |
| 70 | 695,045 | 252,429 | 533,943 |
| 80 | 1,058,500 | 415,000 | 864,000 |
| 90 | 1,608,400 | 833,773 | 1,426,620 |
This table reveals that, in 2006, 70% of households with a primary head 55 to 62 years old have less than $253,000 in total financial assets. Add to their inadequate financial assets the current economic uncertainties in the housing market and in the equities markets and the rising cost of health care, and retirement becomes a more daunting prospect for working Boomers. It is clear that the desire of many of these households to retire early, the current economic landscape, population demographics, and the relatively low asset levels among the majority of these households will keep financial planners, marketers, and product-design teams extremely busy during the next decade. Through comprehensive profiling and in-depth quantitative and attitudinal analysis, the MacroMonitor can be extremely useful in identifying generational themes as well as subsegments of Boomer households that may or may not be ready for retirement.
Regulation and Demographics: Changing the Financial Landscape
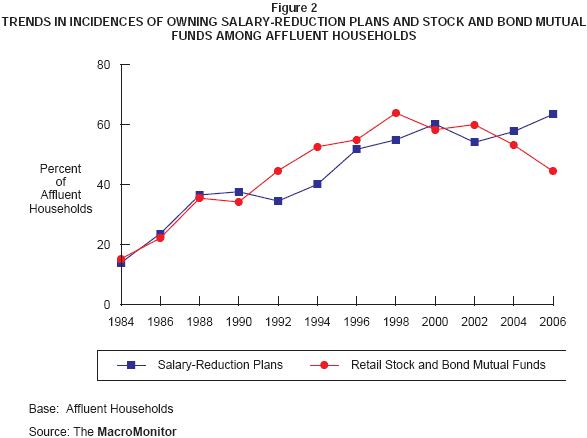
In 1984, the oldest Boomers were 38 years old and just beginning to grasp the impending realities of saving and investing for retirement. Two now-familiar, mutually exclusive investment products—mutual funds and salary-reduction plans (SRPs)—were starting to gain traction among affluent households. (SRPs are the three major types of tax-deferred, employer-sponsored retirement-savings accounts: 401(k)s, 403(b)s, and 457s.) Figure 2 shows the trends in ownership incidences for these two investment products from 1984 through 2006. Both investments saw a roughly fivefold increase in ownership among affluent households in the 14 to16 years after 1984!

The long stock market rally of the 1990s lost steam in the spring of 2000, sending the incidence of owning mutual funds into decline, followed—in 2002—by a drop in the incidence of owning SRPs. The period from 2002 to 2006 saw a rise in the incidence of owning SRPs and a sharp decline in that of mutual funds. The trends in account ownership at the household level suggest that a fundamental shift has occurred in the way affluent households use retail mutual funds and SRPs to invest for retirement.
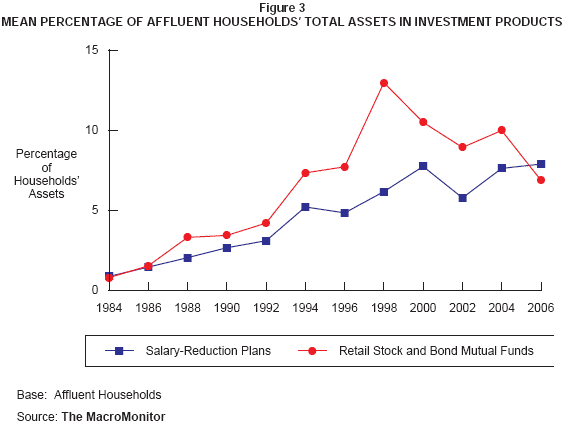
But incidence measures only one dimension. If many owners of mutual funds or SRPs have only minimal investments in each product, the incidence numbers might not be very meaningful. Figure 3 takes into account the relative importance of these two products in the overall asset profile of households and shows the trends in the average percentages of their total investments in retail stock and bond mutual funds and in SRPs. (For this report, household assets comprise home value, value of other real estate, value of business, and balances in stocks, corporate and municipal bonds, Treasury bills and bonds, stock and bond mutual funds, IRAs, SRPs, MMDAs, MMMFs, CDs, U.S. Savings bonds, and individual annuities.) The data show that a dramatic shift has occurred in the roles that retail mutual funds and SRPs play in the asset mix of affluent households. The combined effect of reduced market penetration and lower values of securities drove down the percentage contributions to total household assets of both products in 2002 (in comparison with 1998). By 2006, however, the average percentage of affluent households' assets devoted to SRPs surpassed that of retail mutual funds for the first time.

So what is driving the relative decline in the role of retail mutual funds in the investment portfolios of affluent households? We propose that two primary forces are reshaping the roles that SRPs and mutual funds play in the affluent market. The first is demographics. As the older retired segment of the affluent population continues to grow, its constituents tend to spend down their assets, move money into fixed instruments, and face the prospect that their remaining retail investments will be sold and distributed when they die.
The second is regulatory change. During the past ten years or so the per-person maximum annual allowable investment to SRPs has risen from $9,000 to $15,500—with an additional $5,000 "catch-up" contribution for individuals older than 50 years. Consequently, before considering a similar investment in retail mutual funds, most two-income households would have to divert between $31,000 and $41,000 of pretax income. Therefore, because increasing numbers of households can divert increasing amounts of income into tax-favored investments in their SRPs, a decreasing amount of money is available to invest in retail (after-tax) mutual funds. The introduction of the Roth 401(k) raises the incentive for households with a longer investment horizon that might elect to invest after-tax income. If the up-to-$5,000 per person of additional pretax income that many households can invest in an IRA (traditional or Roth) is factored in, the potential household maximum for tax-favored investments is as high as $51,000. It will be of little surprise if the number of households with any—let alone sizable—retail mutual fund investments is stagnant or declining going forward.