2004–05 MacroMonitor Products and Services Analysis Volume Interim Report: Savings and Investments
| Summary Table of Contents |
Download the summary and table of contents Download the complete interim report (clients only) |
Interim Report Summary: Savings and Investments
By most indicators, the U.S. economy has been expanding at a healthy and solid pace, with positive growth output and controlled inflation. The 2004–05 MacroMonitor's report on household savings and investments trends, however, reveals the not-so-positive financial impact that years of market volatility and industry misconduct have had on the average U.S. consumer. Buffeted by sharp swings in the financial markets—from the go-go markets of the 1990s to the bursting of the market bubble in 2000, a recession in 2001, and now an uncertain so-so equity market—U.S. households appear to be pulling back from owning various savings and investment products.
Revelations of corporate malfeasance and the subsequent loss of trust in financial institutions and professionals have led to signs of falling confidence and lowered risk tolerance in consumer-investment behavior. (See also the previously published Information and Advice section.) And despite questions about the sustainability of Social Security and worries about running out of money at retirement, U.S. households have made no progress in their retirement prospects. The overall incidence of owning retirement accounts among U.S. households has remained flat in the past two years. Likewise, the median balance in households' retirement accounts has not improved during this period.
Consumers' recent behaviors toward the financial markets that led to substantive losses have resulted in depressed confidence in their own ability to manage their finances. But although they may conclude that they are not necessarily the best guide for their own finances, recent revelations about corporate and fiduciary misconduct have also led them to believe that financial institutions and their intermediaries aren't any better. The current disengagement from advice is thus not surprising and may actually be a healthy break for consumers. When they eventually come back and refocus their attention on financial planning and advice—particularly the advance guard of Boomers turning 60 next year and contemplating retirement—trustworthiness will unquestionably be a critical element in their choice of financial advisor.
Key findings from the 2004–05 MacroMonitor data about savings and investments include the following:
- Savings products. Ownership of savings products experienced no growth, and incidences even somewhat declined for CDs and money market accounts between 2002 and 2004. Education savings plans (education savings accounts and 529 plans) likewise did not see increased market penetration during this period.
- Incidence of owning money market accounts (money market deposit accounts and money market mutual funds) fell 12% between 2002 and 2004 to less than one-quarter of households (23%) in 2004.
- Ownership of CDs declined from 19% in 2002 to 16% in 2004.
- With yields on savings products at an all-time low, savings-product owners have had no incentive to increase the balances in their accounts. The median value of households' savings in 2004 is $6,000—$1,000 lower than in 2002.
- Investment products. Incidences of owning various types of investment products outside of retirement accounts have mostly declined from two years ago. The overall household penetration of exposure to any type of security is down by 11% from 37% in 2002 to 33% in 2004. Reflecting the broad economic expansion and moderate returns in the stock market—after the brief recession in the early 2000s—the median market values of securities owned by most household segments are higher now than they were two and four years ago. The median for all U.S. households owning securities is $52,000, up by 30% from two years ago. Nonetheless, consumers in 2004 have generally become less confident, less trusting, and more risk averse.
- Ownership of mutual funds dropped to less than a quarter of U.S. households in 2004 (23%), from a high of 28% in 2002—a decline that may partly be attributable to the fund share-trading scandals that recently roiled the mutual fund industry.
- Incidences of exposure to different types of funds (index, value, global, balanced, and asset allocation) are substantially higher now than two and four years ago. Ownership of bond mutual funds continues to increase as well, indicating a more diversified mutual fund exposure among owners.
- Incidence of owning publicly traded stock fell slightly, from 18% in 2002 to 15% in 2004, but the median value of public stock gained 39% during this period, to $25,000. Not all household segments, however, shared in the overall gain, with beneficiaries mostly concentrated among Younger Boomers and Generation X households—these segments at least doubled the value of their holdings during this period.
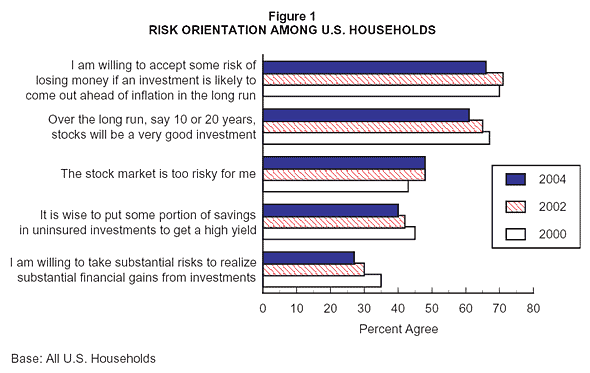
- Overall household investment attitudes in 2004 indicate less willingness than in previous years to take risk in the financial market. The percentage of households that view stocks as a good long-term investment declined to 61% in 2004, from 67% in 2000. Four in ten households—compared to 45% four years ago—consider it wise to put some portion of their savings in uninsured investments to gain a high yield. Just 27% are willing to take substantial risks to realize substantial investment gains in 2004. In 2000, 35% responded similarly. In addition, almost half—compared to 43% in 2000—view the stock market as too risky.
 |
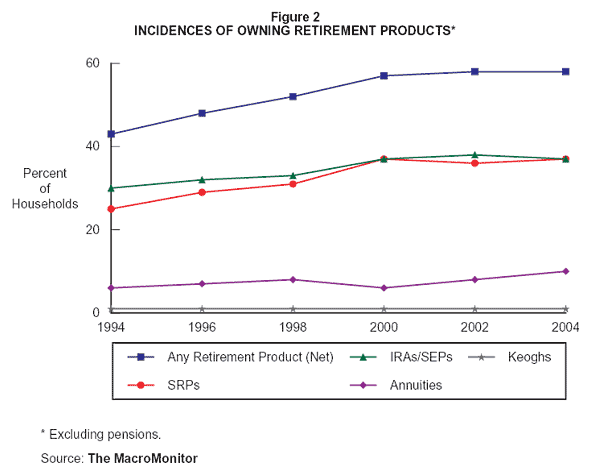
- Retirement products. The overall incidence of retirement accounts (excluding pension plans) remained unchanged, at 58% of all U.S. households. No significant movements occurred between 2002 and 2004 with regard to ownership of pension plans, IRAs/SEPs, and salary-reduction plans (401(k), 403(b), or 457). Incidence of owning annuities, however, is steadily increasing, albeit at a relatively low incidence: 10% of U.S. households own this product in 2004, compared to 8% in 2002 and 6% in 2000. The median value of savings in retirement products in 2004 is down slightly from in 2002—$36,000, compared to $38,000—but still higher than it was in 2000 ($31,000).
- Retirement preparedness differs by household segments. Among the Age Cohorts, Older Boomers maintain the highest median value in retirement savings in 2004: $76,000. The gap in retirement savings among U.S. households is most evident by Socioeconomic Level, with the median retirement savings of the most affluent households ($76,000 in 2004) more than seven times higher than those of households in the lowest income level ($10,000).
- Retirement attitudes have not significantly changed for U.S. households overall. The level of concern that permeates households in 2004 is the same as in 2002. Almost seven in ten households are concerned about having adequate income during retirement, about six in ten households don't know how much to save for retirement, and roughly half expect to rely on Social Security for their retirement income.
 |
- Illiquid assets. The incidence of home ownership shows a steady increase, reaching almost 70% in 2004. Incidences of owning other real assets—such as businesses, other real estate, vehicles, and tangible assets—show only minor changes from previous years.
- Although certain pockets of the country are experiencing double- or even triple-digit growths in the price of houses, the overall median market value of owned homes has declined somewhat from $120,000 in 2002 to $110,000 in 2004. And with low interest rates encouraging many homeowners to refinance or trade up to bigger houses, the median value of equity now in primary residences has also decreased, from $65,000 to $61,000 during this same period.
- Reflecting the booming market in the purchase of second homes or rentals, the median value of other real estate has been rising—$85,000 in 2004, which is 31% higher than the median in 2000, $65,000. Younger and Older Boomers have been the most active Age Cohort segments in the purchase of other real estate.
- More than 16 million households (13%) report owning a business or professional practice in 2004, continuing an upward trend from 12 million in 2000 and 13.5 million in 2002. The percentage of owner households having a business or professional practice with a positive value has declined somewhat, to 82% in 2004 from 87% in 2002, but remains higher than it was in 2000 (69%).
<< See other Interim Reports
Interim Report Table of Contents
| Savings and Investments | ||||
| Summary | 1 | |||
| Savings Products | 5 | |||
| Savings Accounts | 10 | |||
| Certificates of Deposit | 15 | |||
| Money Market Deposit Accounts | 21 | |||
| Money Market Mutual Funds | 26 | |||
| U.S. Savings Bonds | 31 | |||
| Education Savings Accounts | 36 | |||
| 529 Plans | 39 | |||
| Investment Products | 42 | |||
| Stock and Bond Mutual Funds (Retail) | 49 | |||
| Individual Stocks, Bonds, and Other Securities | 57 | |||
| Wrap and Separately Managed Accounts | 66 | |||
| Margin Accounts | 68 | |||
| Retirement Products | 69 | |||
| Individual Retirement Accounts and Simplified Employee Pensions | 76 | |||
| Salary-Reduction Plans | 85 | |||
| Keogh Accounts | 91 | |||
| Individual Annuities | 92 | |||
| Pensions | 98 | |||
| Illiquid Assets | ||||
| Tangible Assets | 101 | |||
| Businesses | 106 | |||
| Primary Residence | 110 | |||
| Other Real Estate | 115 | |||
| Limited Partnerships | 120 | |||
| Motor Vehicles | 121 | |||
| Personal Trusts | 128 | |||
| Custodial Accounts | 133 | |||
| Private Banking | 138 | |||
<< See other Interim Reports